Visual Graphs
While the visual mode offers a good amount of information for most practical applications, there is an ever better mode: visual graphs.
$ r2 -A ./hello
[x] Analyze all flags starting with sym. and entry0 (aa)
[x] Analyze len bytes of instructions for references (aar)
[x] Analyze function calls (aac)
[ ] [*] Use -AA or aaaa to perform additional experimental analysis.
[x] Constructing a function name for fcn.* and sym.func.* functions (aan))
 -- THE ONLY WINNING MOVE IS NOT TO PLAY.
 [0x08048350]>
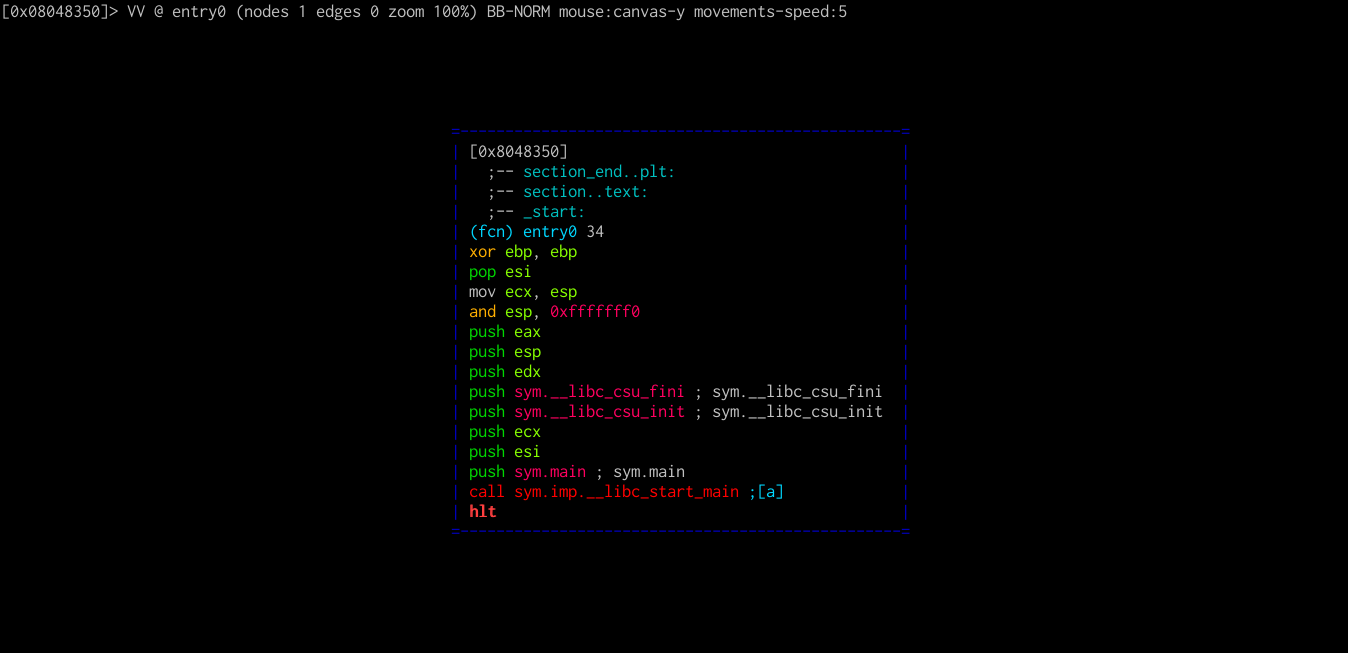
We can enter visual graphs mode by using VV
As always, a help menu for this mode can be accessed by pressing ?.
Visual Ascii Art graph keybindings:
.            - center graph to the current node
:cmd         - run radare command
'            - toggle asm.comments
;            - add comment in current basic block
/            - highlight text
"            - toggle graph.refs
>            - show function callgraph (see graph.refs)
<            - show program callgraph (see graph.refs)
Home/End     - go to the top/bottom of the canvas
Page-UP/DOWN - scroll canvas up/down
C            - toggle scr.colors
hjkl         - scroll canvas
HJKL         - move node
tab          - select next node
TAB          - select previous node
t/f          - follow true/false edges
g([A-Za-z]*) - follow jmp/call identified by shortcut
G            - debug trace callgraph (generated with dtc)
r            - refresh graph
R            - randomize colors
o            - go/seek to given offset
u/U          - undo/redo seek
p/P          - rotate graph modes (normal, display offsets, minigraph, summary)
s/S          - step / step over
V            - toggle basicblock / call graphs
w            - toggle between movements speed 1 and graph.scroll
x/X          - jump to xref/ref
+/-/0        - zoom in/out/default
We can go to any offset just as in visual mode (o and then main<Enter>).
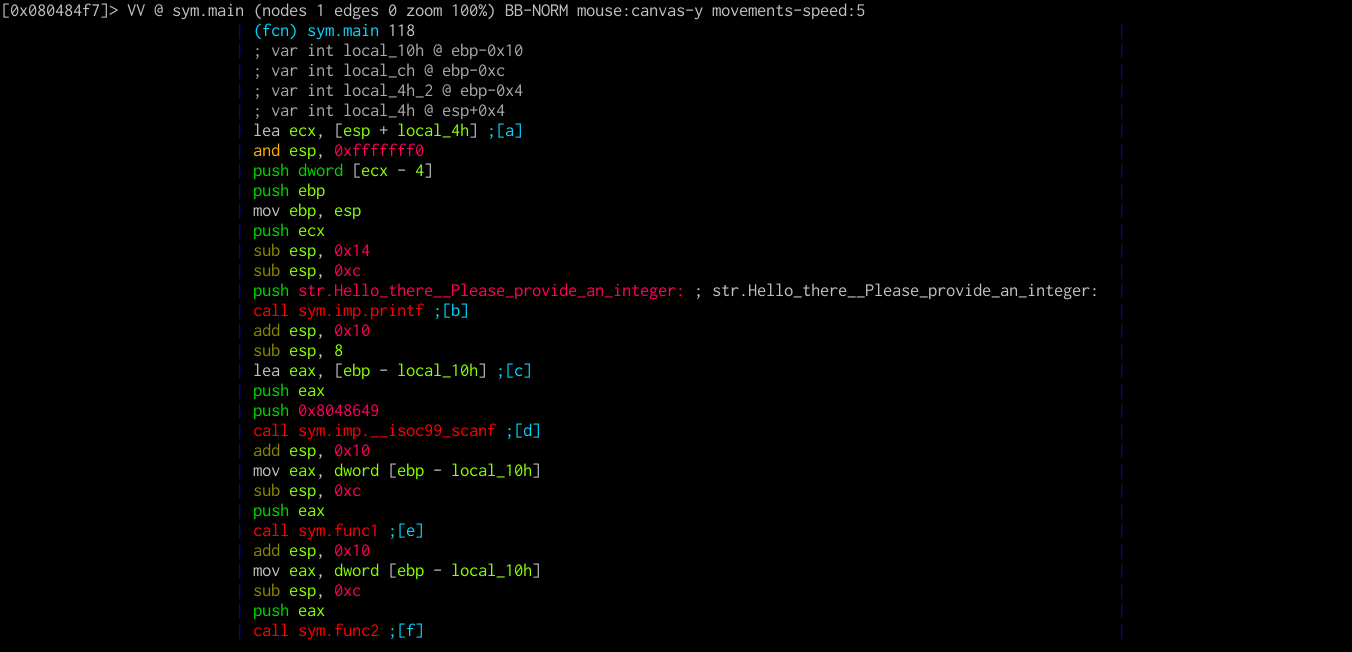
Notice that some instructions, such as lea, jmp or call are followed by short labels in square brackets. These labels, also known as shortcuts, are there to allow you to quickly go to them by using g. Let's go to func1 via ge.
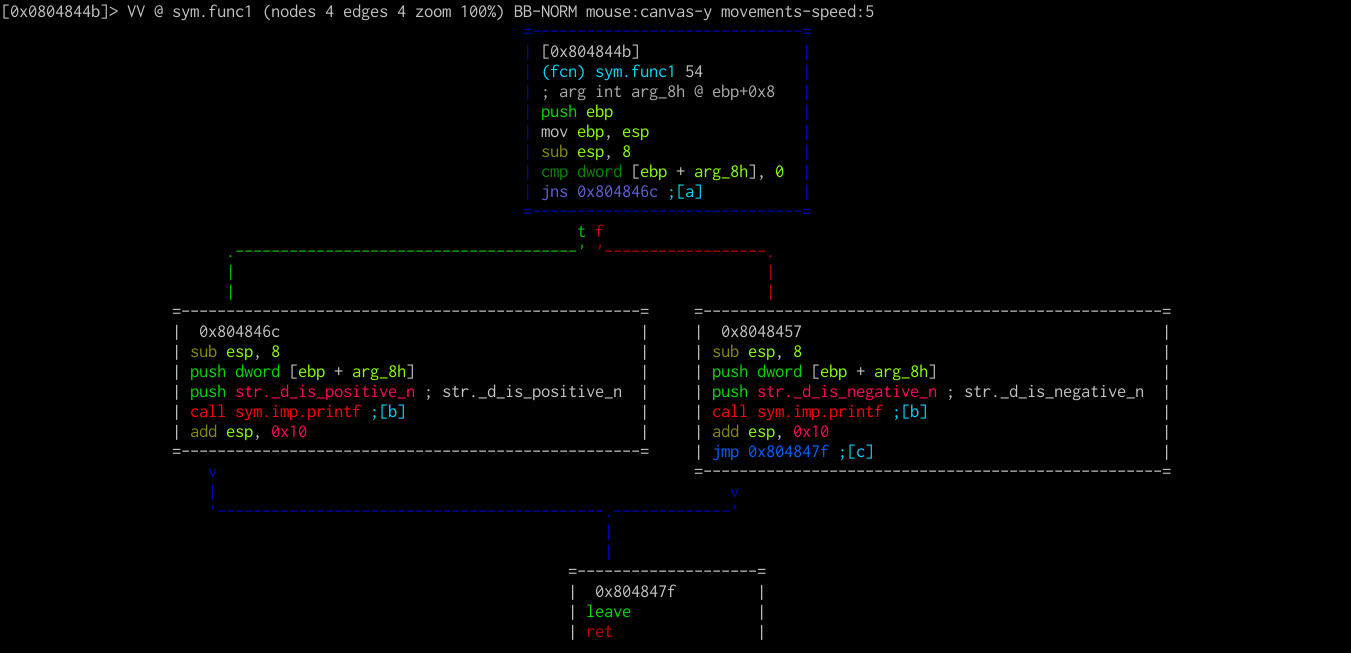
Notice that whenever the control flow changes on a condition, the ASCII graph branches. You can move the graph around using the hjkl keys. You can follow the flow using t and f, which stand for true and false, and undo movement using u.
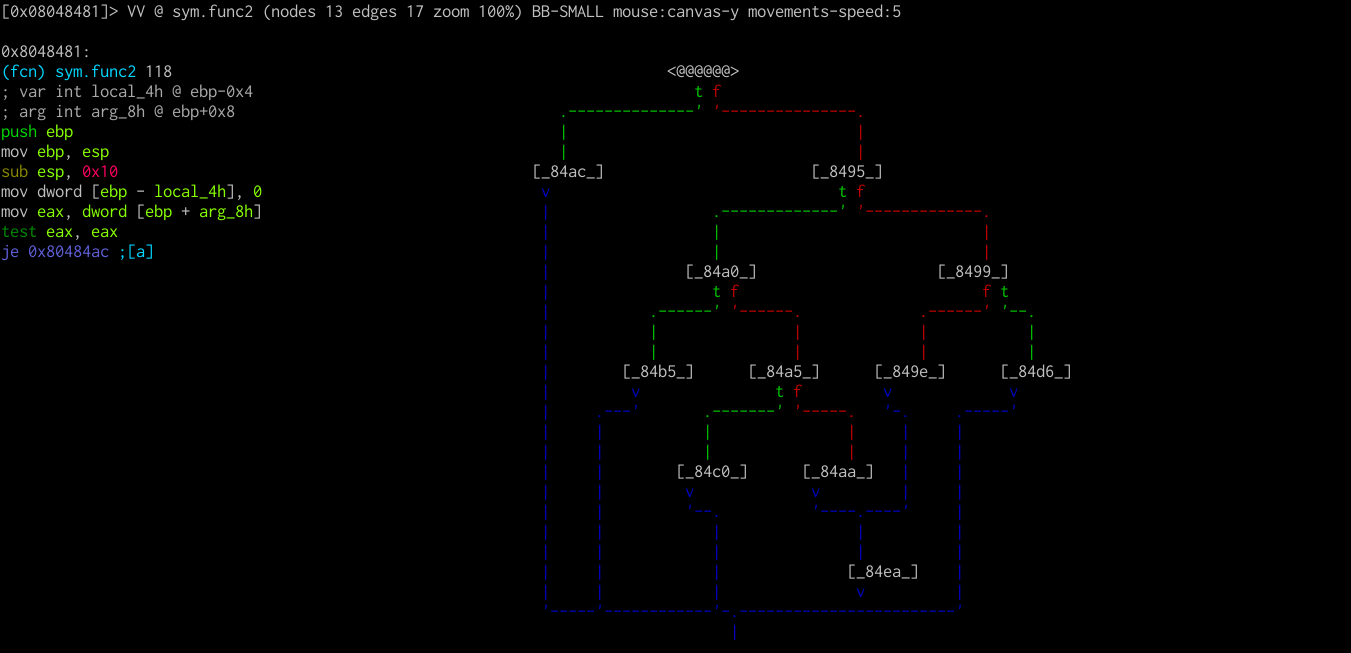
Let's go back to main. We can do this quickly by pressing x and then 0. x will bring up the functions from which func1 is called (in our case, only main). Now let's go to func2 with gf.
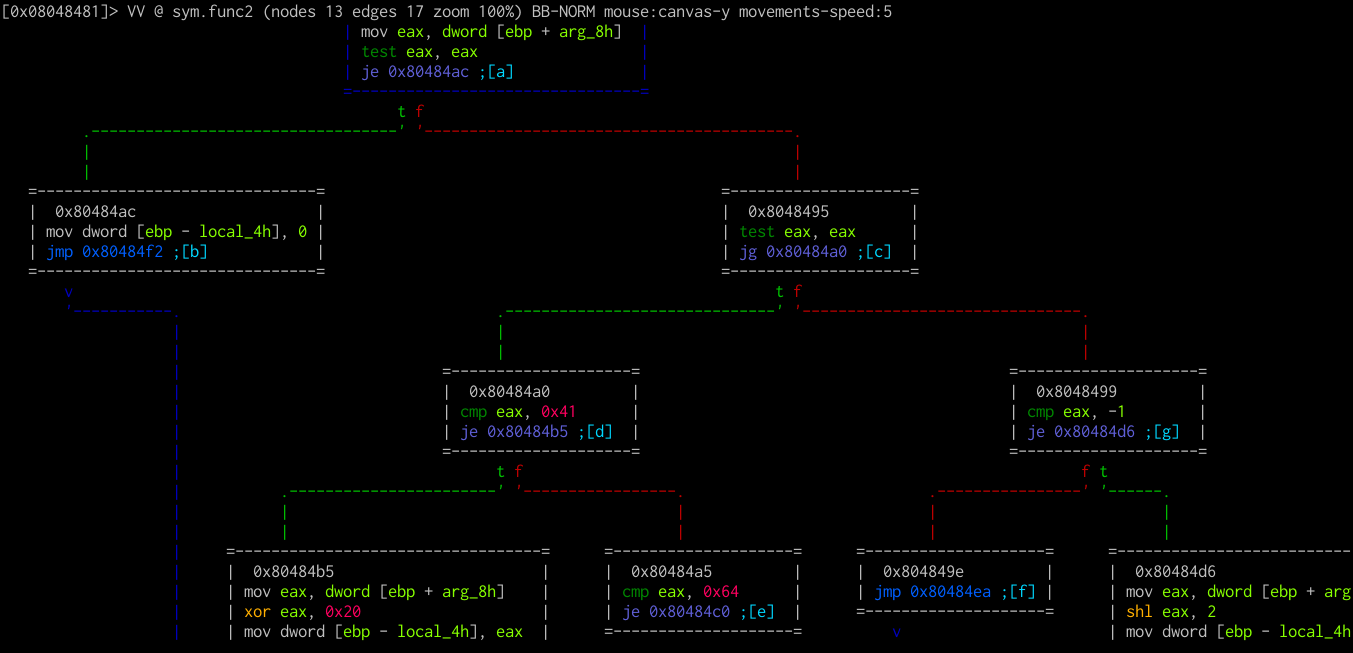
Notice that this function is noticeably larger and cannot fit on the screen. We can cycle display modes using p/P.
One last useful display is the callgraph of a function which, as the name suggests, contains the functions a certain function calls.
The callgraph for a function can be displayed by pressing >.
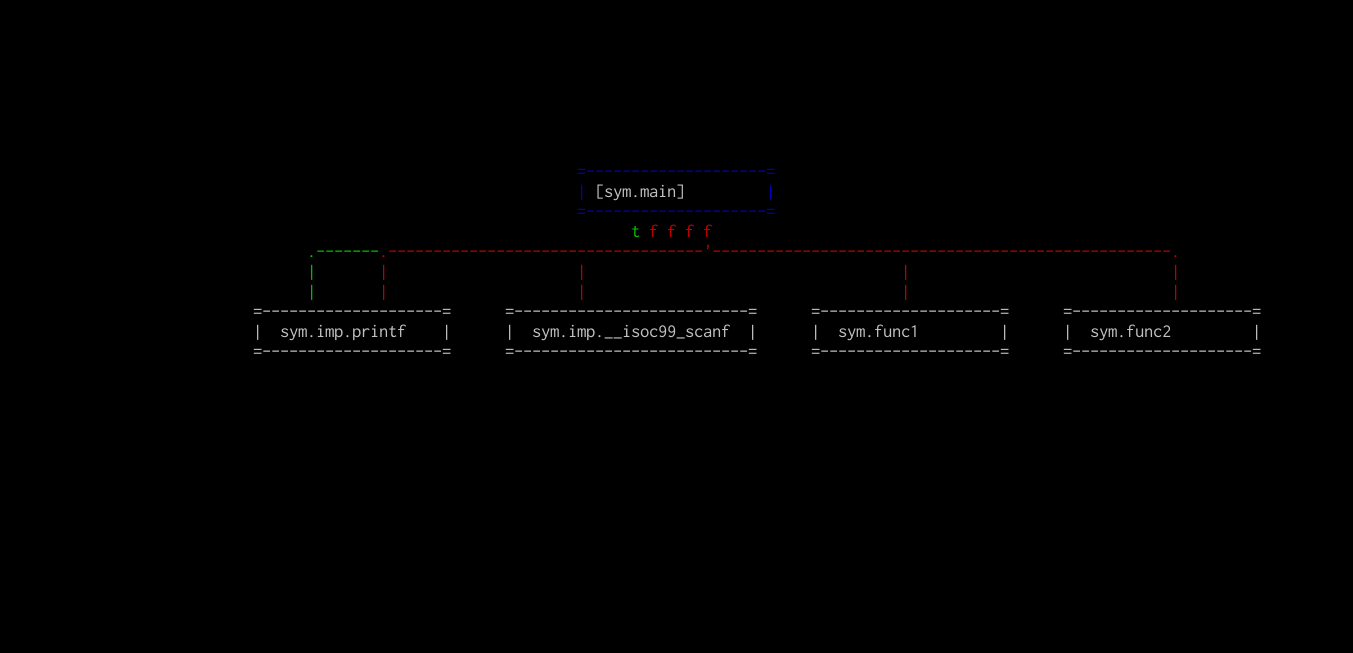
Sometimes, this callgraph can get pretty large, since functions can be called in various blocks. That's where the summary mode comes into play (one of the modes when cycling using p/P).
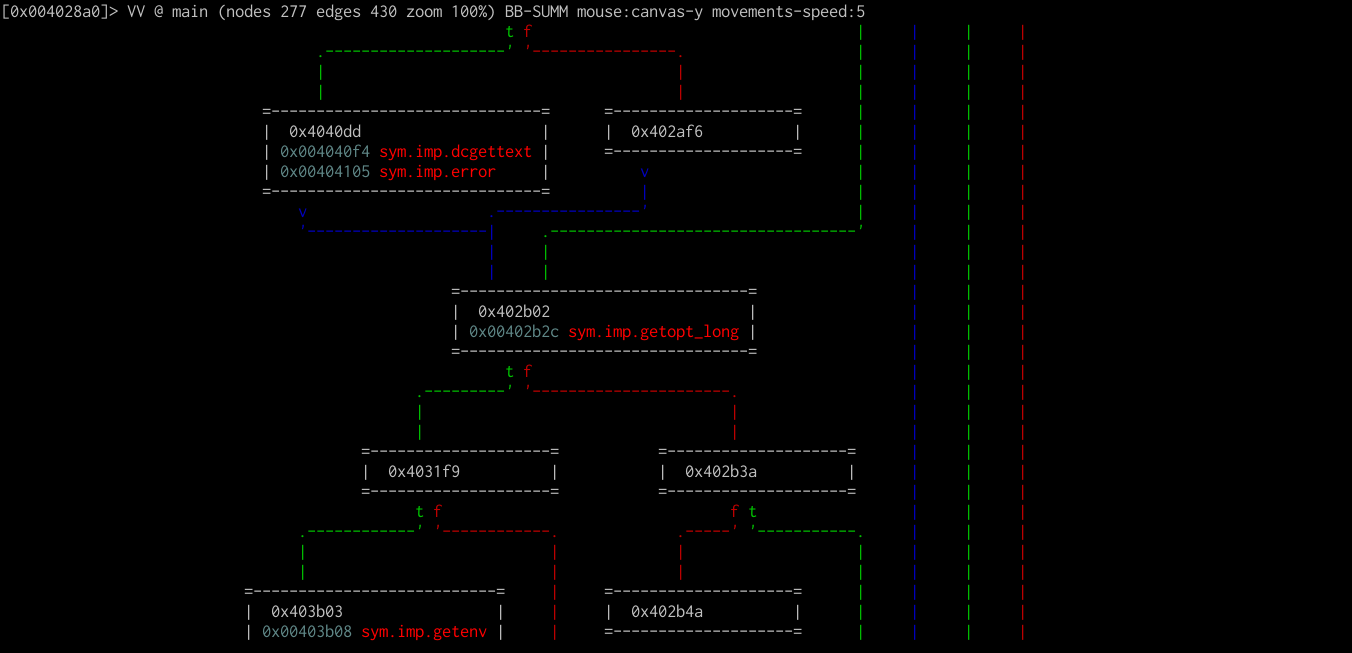
This display is very useful for getting the basic outline of what a program does at a more high level.